Introduction
In the world of intriguing puzzles and brain teasers, the “Goat Tower Riddle” stands out for its unique blend of whimsy and mathematical challenge. The puzzle goes like this:
A tower with 10 floors can each accommodate one goat. Ten goats, each with a random preference for a floor, approach the tower. A goat will settle on its preferred floor if unoccupied; otherwise, it continues upward seeking an empty floor. If no floors are available, it’s left stranded on the roof. The question is: What are the odds that each of the 10 goats finds its own floor, leaving none on the roof?
A simulation Approach
To solve this, we turn to R, a language favored for statistical computing and graphics. We simulate the scenario using a function count_got_on_roof() in R.
Function Breakdown
Initialization: We create sequences for floors and goats, and randomly assign floor preferences.
Occupancy Simulation: Each goat, in turn, chooses the first unoccupied floor that meets or exceeds its preference.
Counting Unoccupied Floors: Finally, we count floors without goats.
#' Count Unoccupied Floors in a Building
#'
#' This function simulates a scenario where a specified number of goats each
#' choose a floor in a building to occupy, based on their preferences.
#' The function returns the number of unoccupied floors after all the goats
#' have made their choice.
#'
#' @param x An integer value representing the number of floors in the building
#'  and also the number of goats. Defaults to 10.
#' @return An integer indicating the number of unoccupied floors after all goats
#'  have chosen a floor.
#' @examples
#' count_got_on_roof(10)
#' count_got_on_roof(15)
#' @export
#'
#' @details The function creates a sequence of floors and goats. Each goat
#' randomly selects a preferred floor. The algorithm then assigns each goat to
#' the first unoccupied floor that meets or exceeds their preference, ensuring
#' that each floor can only be occupied by one goat. The function finally counts
#' and returns the number of unoccupied floors.
count_got_on_roof <- function(x = 10){
  floars <- seq(1, x, 1)
  goats <- seq(1, x, 1)
  preferences <- sample(floars, x, replace = TRUE)
  occupied <- rep(0, x)
  for (goat in goats) {
    # A goat make is preference
    preference <- preferences[goat]

    # create a temporary vector
    occupied_temp <- occupied

    # Place holder to say that those cannot be choose
    occupied_temp[floars < preference] <- 2

    # Find the first empty floor
    first_empty_floar <- which(occupied_temp == 0)[1]

    # place the goat on the floor
    occupied[first_empty_floar] <- 1
  }

  return(sum(occupied == 0))
}
Simulating the Scenario
Once the function is established, simulating a multitude of scenarios becomes remarkably straightforward. It simply involves invoking the function n times, where n represents the desired number of simulations we wish to perform. This process effortlessly multiplies our scenarios, providing a wealth of data from which to draw conclusions.
simulations <- 1e+06
number_goat_floar <- 10

goat_on_roof <- replicate(simulations, count_got_on_roof(x=number_goat_floar))
probability <- sum(goat_on_roof == 0) / length(goat_on_roof)
probability
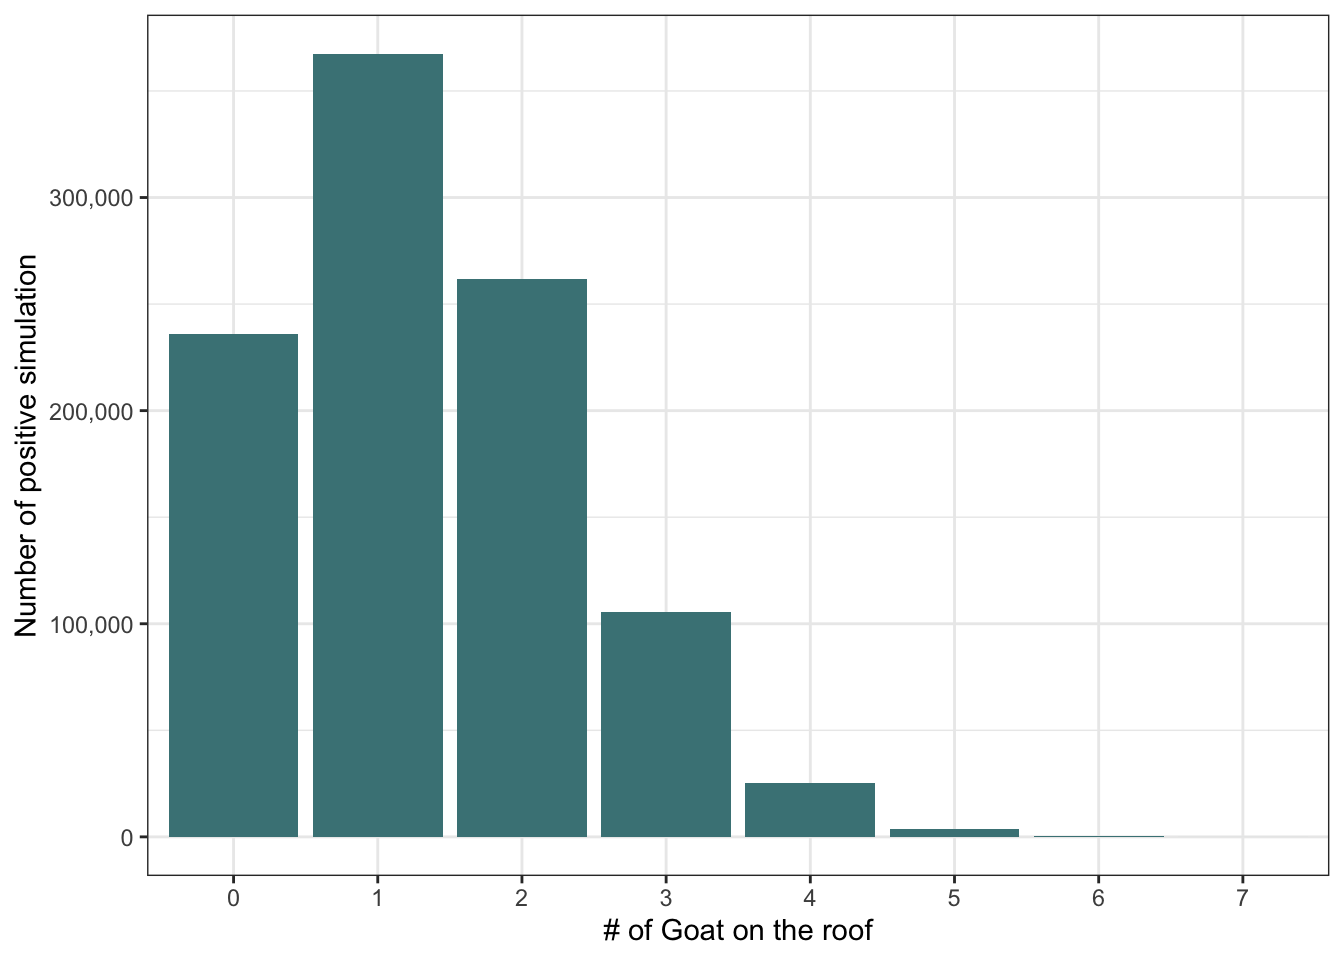
## [1] 0.23579This result indicates that there is a probability, precisely calculated as 24%, that no goats will end up on the roof.
Visual Representation
The simulation approach offers a distinct advantage over traditional numerical methods. It not only determines the probability of none of the goats on the roof but also allows us to easily compute the average number of goats that end up on the roof. This calculation can be performed with the following simple steps:
mean(goat_on_roof)## [1] 1.329557We can visualize the distribution using ggplot:
tibble(goat_on_roof = as.factor(goat_on_roof)) %>%
    group_by(goat_on_roof) %>%
    count(goat_on_roof, sort = TRUE) %>%
    ggplot(aes(goat_on_roof, n))+
    geom_col(fill = "#488286") +
    scale_y_continuous(labels = scales::comma) +
    labs(x= "# of Goat on the roof", y= "Number of positive simulation")
Another significant advantage of using simulation lies in its flexibility. We can easily alter the number of goats and floors and observe how these changes affect the outcome. Intriguingly, our simulations reveal that even when the proportion of floors to goats remains constant, increasing their numbers leads to a higher likelihood of goats ending up on the roof. This finding is thought-provoking. It suggests that in situations where resources are seemingly sufficient, the sheer number of individuals involved can still lead to resource shortages without effective collaboration. This mirrors a real-world scenario: even in the presence of ample resources, the lack of cooperation can result in many individuals being left without what they need. It highlights the importance of collaboration, especially in large groups, to ensure equitable resource distribution.
multi_sim <- function(number_goat_floar){
    goat_on_roof <- replicate(1e+05, count_got_on_roof(x=number_goat_floar))
    res <- tibble(goat_on_roof = as.factor(goat_on_roof),
                  number_goat_floar = as.factor(number_goat_floar))
    return(res)
}

multi_goat <- map(seq(10, 100, 10), multi_sim)
multi_goat <- reduce(multi_goat, bind_rows)

multi_goat %>%
    group_by(goat_on_roof, number_goat_floar) %>%
    count(sort = TRUE) %>%
    ggplot(aes(goat_on_roof, n, fill = number_goat_floar))+
    geom_col(position = position_dodge()) +
    scale_y_continuous(labels = scales::comma)  +
    scale_fill_brewer(palette = "Set3") +
    labs(x = "# of goat on the roof", y = "Number of positive simulation",
         fill = "# of goats \n and floors")
Conclusion
The Goat Tower Riddle, at its core, is a splendid demonstration of how simulation can be a powerful tool in solving probability problems, especially when traditional mathematical formulas are complex or infeasible. In this case, the riddle posed a scenario where calculating probabilities through conventional means would have been cumbersome and intricate. However, by turning to simulation, we bypassed the need for explicit formulaic solutions.
Our approach, leveraging the capabilities of R programming, was to replicate the scenario numerous times. The high volume of iterations allowed us to observe the outcomes and measure probabilities based on empirical data rather than theoretical calculations. Each iteration of the simulation represented a unique unfolding of events, capturing the essence of randomness and choice inherent in the riddle.